7.4.7. Basic failure rate derivation for “non-standard model” items#
When the miscellaneous item under consideration does not match the criteria of the miscellaneous equivalent class (e.g. SSPA – Solid State Power Amplifier - cannot be compared to a TWTA in terms of technology), it is necessary to build a reliability model based on engineering/PoF approach as defined hereafter.
Once the reliability model is established it can be tailored as necessary based on the approach presented in Section 7.4.5.
First, it is necessary, to collect/define all technical information about the miscellaneous item in order to characterize it (refer to Section 7.4.5). Then the basic failure rate \(\lambda_{1}\) = \(\lambda_{B}\) is defined (Step 1) as discussed below. Finally, the tailoring of this basic failure rate follows the “standard model” procedure as presented in the subsections of Section 7.4.5) corresponding to Step 2 to Step 7.
7.4.7.1. DFMEA / PFMEA#
After the first item characterization, a DFMEA and a PFMEA are performed in order to assess the failure modes due to:
Design errors,
Manufacturing errors.
It is recommended to use the [BR_MIS_8, BR_MIS_9] which provides the method to apply for a DFMEA / PFMEA. PFMEA is also specified in [NR_MIS_5].
FMEA: Required for every unit
As a tool/method: Supporting the design of the unit, identifying all the elementary “failure modes” due to “random failure” (part intrinsic reliability) as defined in the failure mode list (refer to [NR_MIS_5]).
At unit level: Under supplier responsibility
At system level: Integrated at system level by a system RAMS engineer (including HSIA supporting the failure tolerance: observability in-orbit…)
DFMEA: Required on critical functions only (Risk analysis)
As a tool/method: Supporting the product quality identifying all the elementar failure mode’s due to design errors. It includes, as a minimum, the failure modes identified by FMEA,
At unit level:: Under unit designer / Quality assurance (QA) responsibility,
At system level: Reviewed by procurement within the unit acceptance process.
PFMEA: Required on critical functions only (Risk analysis)
As a tool/method: Supporting the product quality identifying all the elementary failure modes due to manufacturing errors,
At unit level: Under unit Quality assurance (QA) responsibility,
At system level: Reviewed by procurement within the unit acceptance process.
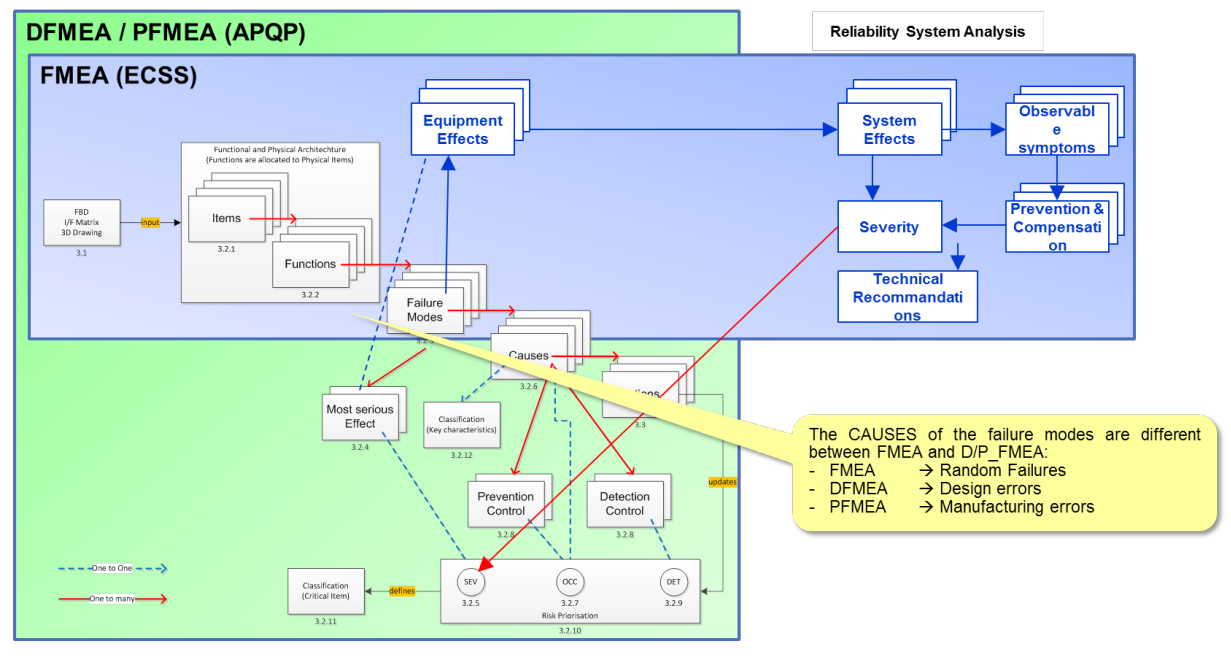
Fig. 7.4.8 Differences between FMEA, DFMEA and PFMEA#
Fig. 7.4.8 highlights the differences and the commonalities between FMEA, DFMEA and PFMEA.
Fig. 7.4.9 provides an example of DFMEA and PFMEA at elementary part level (interconnect be-tween Solar cells). The left-hand side of the table refers to FMEA (blue perimeter in Fig. 7.4.8), whereas the right-hand side refers to DFMEA data (green perimeter in Fig. 7.4.8).
The main outcome is the ranking of every root cause (design error, manufacturing error) in:
The Risk Priority Number (RPN), which is derived, is an index reflecting the residual technical risk.
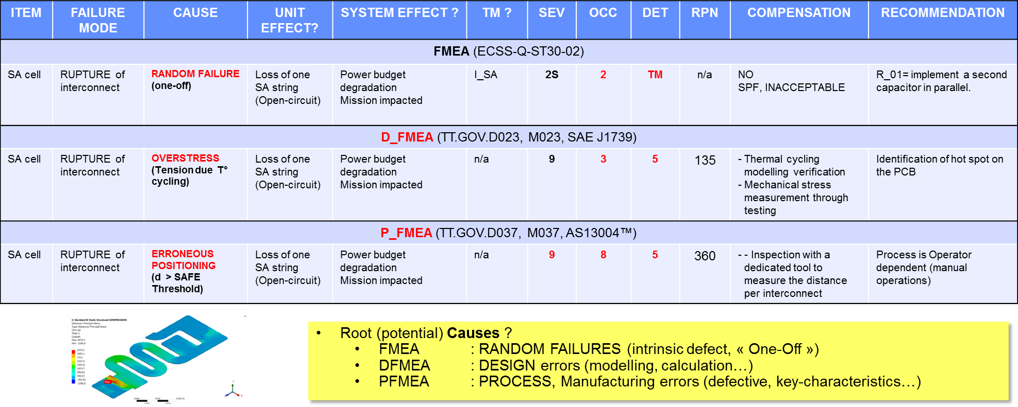
Fig. 7.4.9 DFMEA and PFMEA at elementary part level (example of solar cells interconnect)#
|
||||||||||||||||||||||||||||||||||||||||||||||||||||||||||||||||||||||||
Where, TRL means Technology Readiness Level.
7.4.7.2. Probability assessment#
The occurrence scale of Section 7.4.7.2 is used to derive, based on engineering judgement, either a failure rate or a probability of failure, per failure mode:
In the case that the detectability (i.e. the capacity to detect on ground the defect) is certain, the probability of failure is set to 0 under the condition that no degradation in time is expected (e.g. if a particle inside a RF passive part which originates from manufacturing is necessarily detected on ground with no possibility to get a particle during the mission, then the associated probability of failure is set to 0).
A probability of occurrence is assigned to every failure mode, and the sum provides the probability of occurrence of the item.
A failure rate could be derived assuming the probability of occurrence on the specified lifetime is equal to the probability assigned to the failure mode, e.g. probability assessed to \(10^{-4}\) as level 4 (Table 7.4.6) leads to a failure rate of \(1,14 10^{-9}\) for 10 years.
This represents the basic failure rate or the basic probability of failure. Then, the general process to adapt this failure rate is described in Section 7.4.5 of this part.
Note
This probability ranking needs to be clearly justified and documented.